
SolarOps
One screen for every farm: clear visibility into output, early fault detection and reports that run themselves.

- Client
- Solar farm operator in Vietnam's South Central Coast region
- Industry
- Energy
- Services
- Enterprise software, IT & Cloud services
- Duration
- 24 weeks
- Year
- 2024
Project overview
Scope of work
The operator manages multiple solar farms across the South Central Coast provinces, each using the monitoring software bundled with a different vendor's inverters. Engineers had to log in to several systems, export figures manually and compile daily reports in spreadsheets, so minor faults often surfaced only after end-of-day output had already dropped.
SolarOps was created to bring all operational data into one place: track output in near real time, detect anomalies early, automate periodic reporting, and build an infrastructure foundation solid enough to scale whenever the business invests in new farms.
Challenges
Multiple data standards
Inverters, irradiance sensors and meters from different vendors return data in inconsistent formats, frequencies and units.
Noisy alerts
Cloud cover and dust cause natural swings in output; with hard thresholds, the operations team would be flooded with false alarms.
On-site connectivity
Connections at some farms are unstable, so data can be interrupted for hours and must be fully backfilled once the network recovers.
GREEN TECH's solution
GREEN TECH built a Python data-collection layer with a dedicated adapter for each device type, normalizing everything into a common model before storing it in PostgreSQL. Instead of fixed thresholds, the system compares actual output with the expected output calculated from measured irradiance, so it only raises an alert when the gap is genuinely abnormal. Collectors installed at each farm keep a local buffer so no data is lost when the connection drops. All services are packaged with Docker and run on Kubernetes with autoscaling, drawing on extra resources only during report-processing windows.
Key features
Farm map
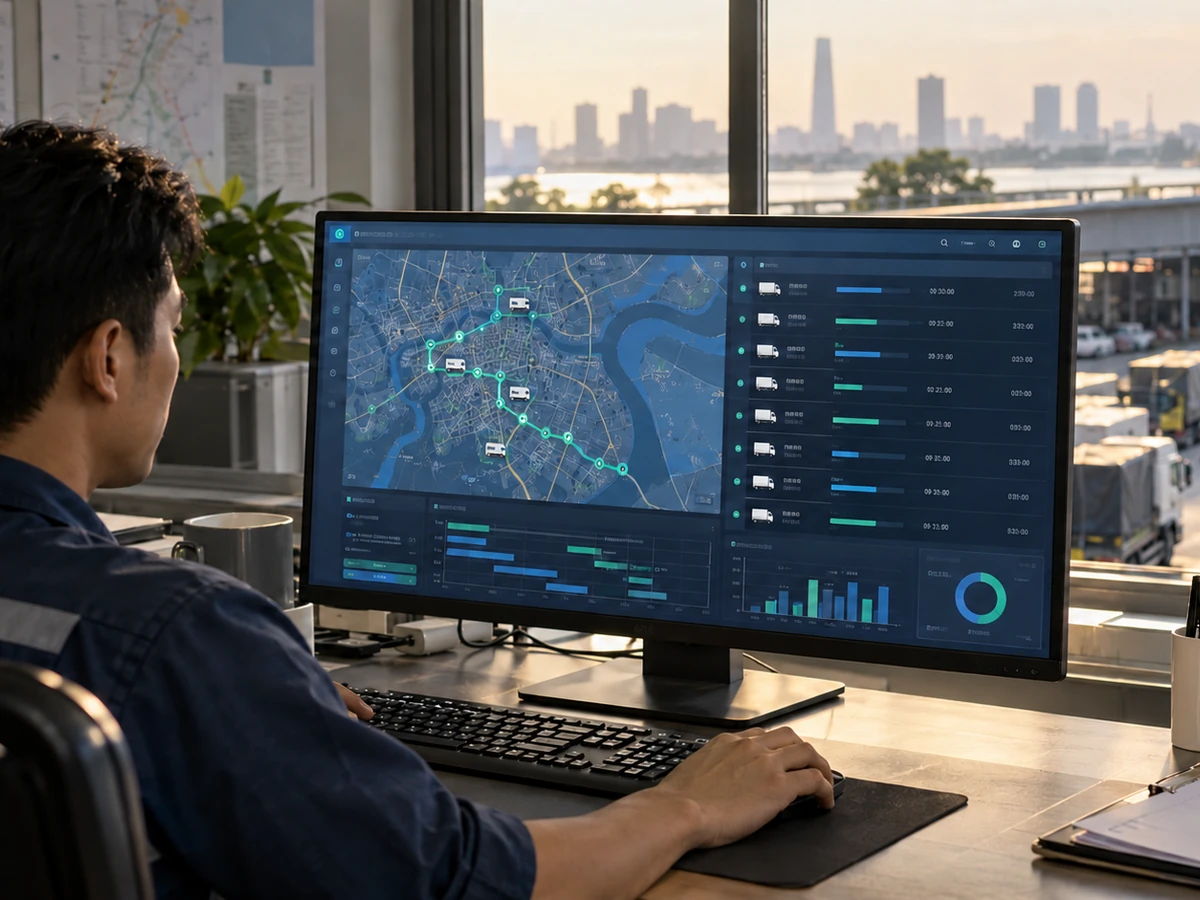
A dark-themed dashboard shows each farm's location, current output and status on a map, designed for the large screens of a control room.
Performance-based alerts
Detects panel strings or inverters performing below expectations and sends prioritized alerts to the engineer responsible.
Automated operations reports
Daily, weekly and monthly reports are generated and delivered on schedule, covering output, system performance and downtime.
Incident log
Every alert is linked to a work ticket that records the assignee, time to resolution and root cause for later analysis.
Results
-40%
Fault detection time
15 hours
Saved on reporting every week
+2.1%
Output from faster fixes
Once the system went live, the operations team shifted from hunting for data to resolving issues as soon as they appear. New farms can be added simply by configuring the matching adapter, with no changes to the architecture. Autoscaling infrastructure keeps cloud costs closely in line with actual demand — an approach that fits the very clean-energy sector the client is committed to.
Technologies used
More projects


Have an idea for your next project?
Share your goals with GREEN TECH. We'll analyze your requirements, propose the right solution and send you a detailed quote, completely free of charge.
Get a free consultation
Get in touch
Start Your Project
Today
Work with us
- Fast response within 24 hours.
- Work directly with experts.
- Clear strategic advice.